Marc Reinganum, Chief Quantitative Strategist bei State Street Global Advisors (SSgA), beschreibt den “Jänner-Effekt” unter http://finanzmarktfoto.at/page/pic/14077 .
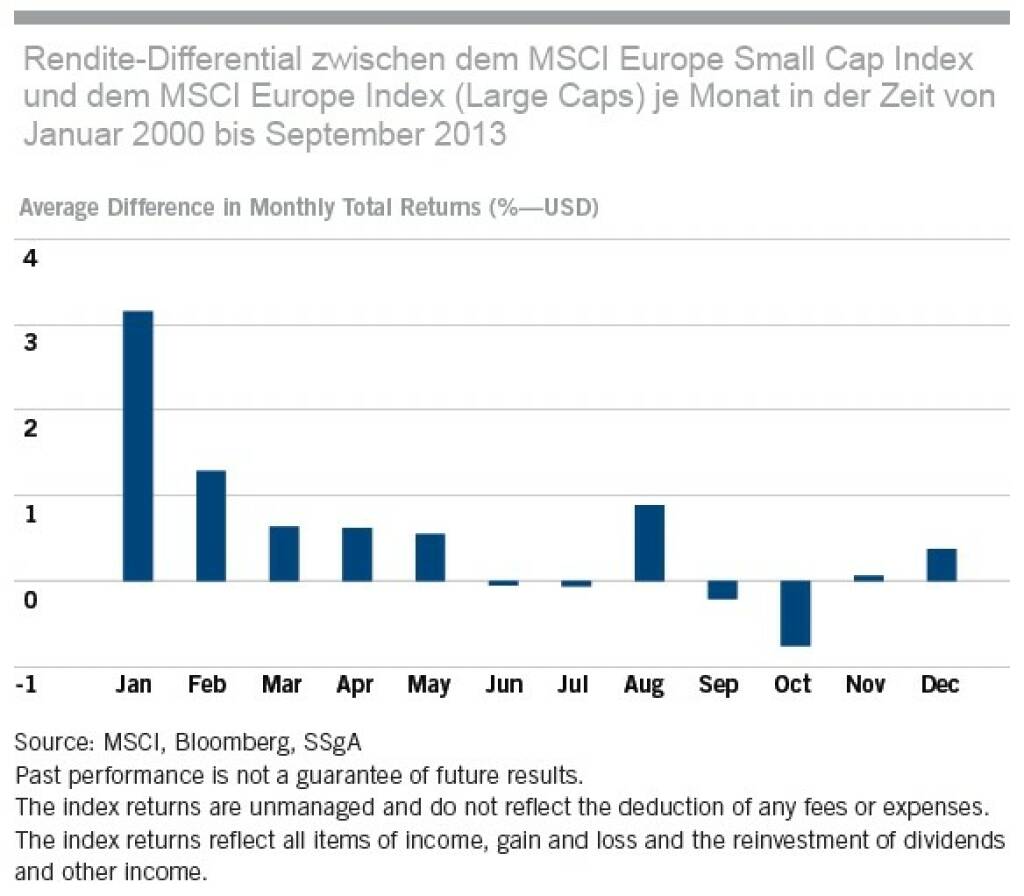
Europäische Small Caps seit Jänner 2000
, © SSgA (05.01.2014)
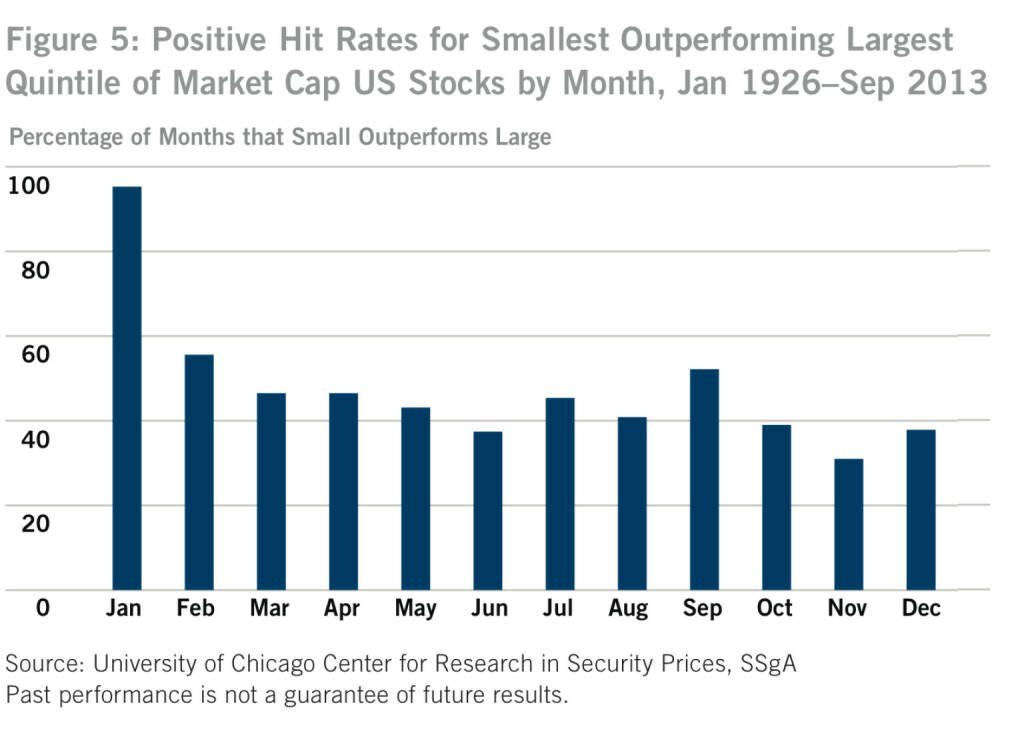
US-Figure 5: Positive Hit Rates for Smallest Outperforming Largest Quintile of Market Cap US Stocks by Month, Jan 1926–Sep 2013, © SSgA (05.01.2014)
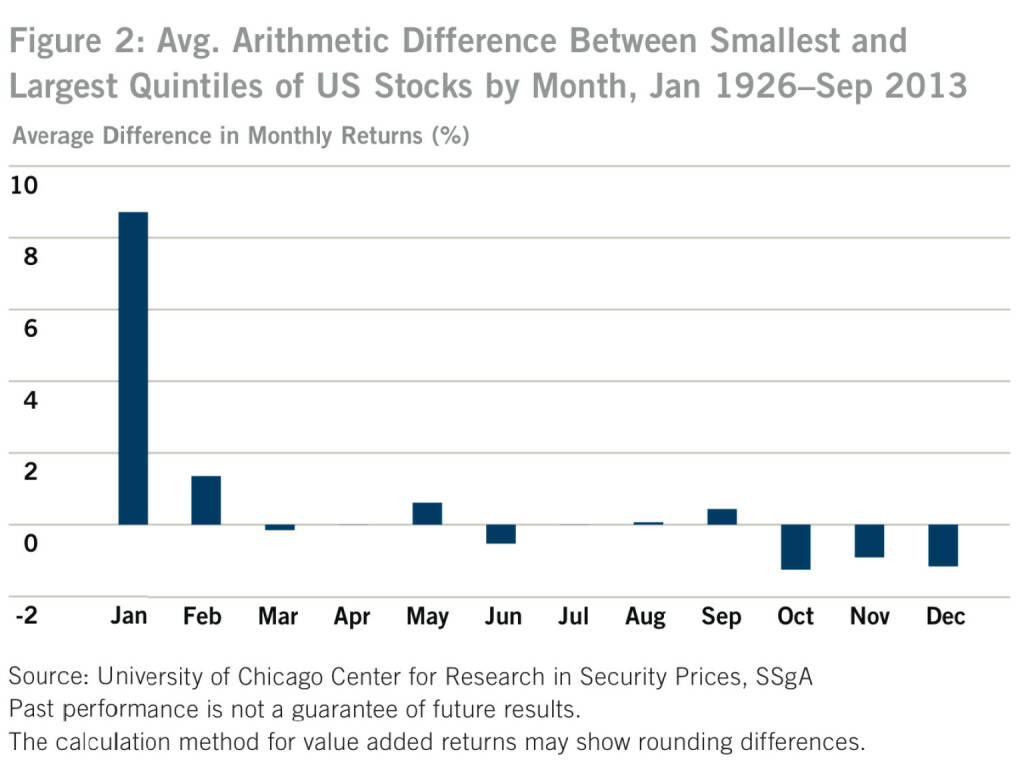
US-Figure 2: Avg. Arithmetic Difference Between Smallest and Largest Quintiles of US Stocks by Month, Jan 1926–Sep 2013, © SSgA (05.01.2014)

US-Figure 3: Avg. Return Difference in January Between Smallest and Largest Market Cap Quintile US Stocks in Different Periods, © SSgA (05.01.2014)
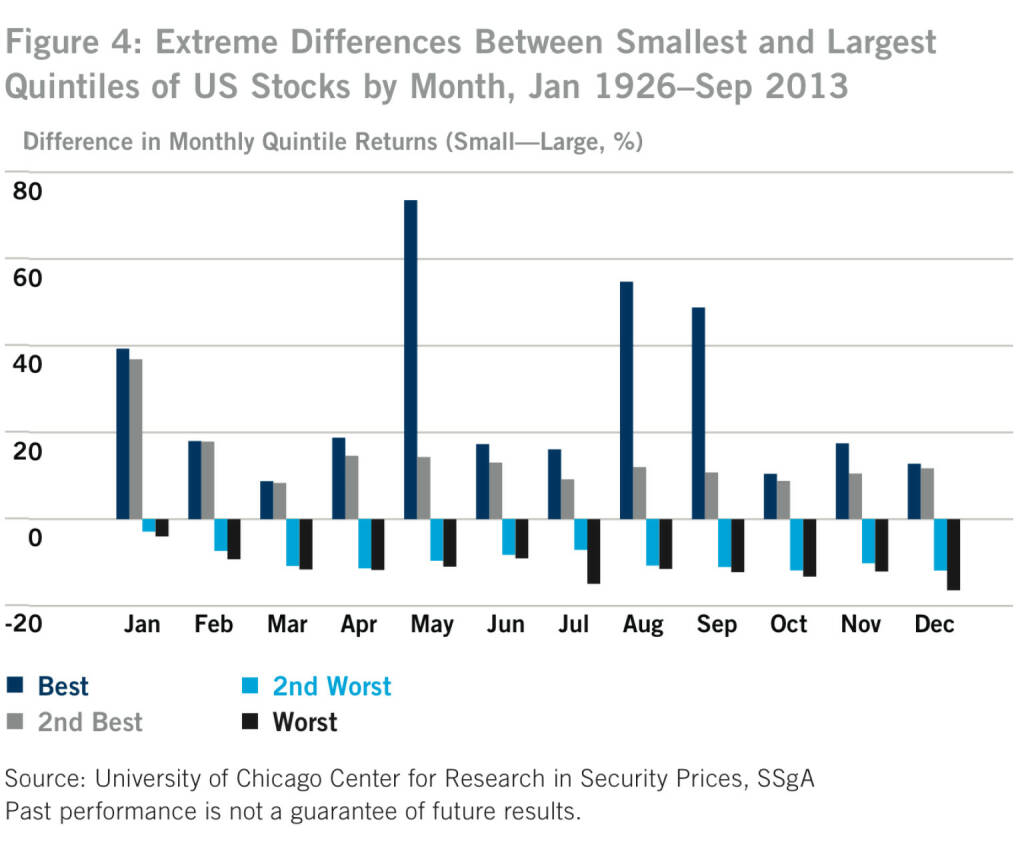
US-Figure 4: Extreme Differences Between Smallest and Largest Quintiles of US Stocks by Month, Jan 1926–Sep 2013, © SSgA (05.01.2014)
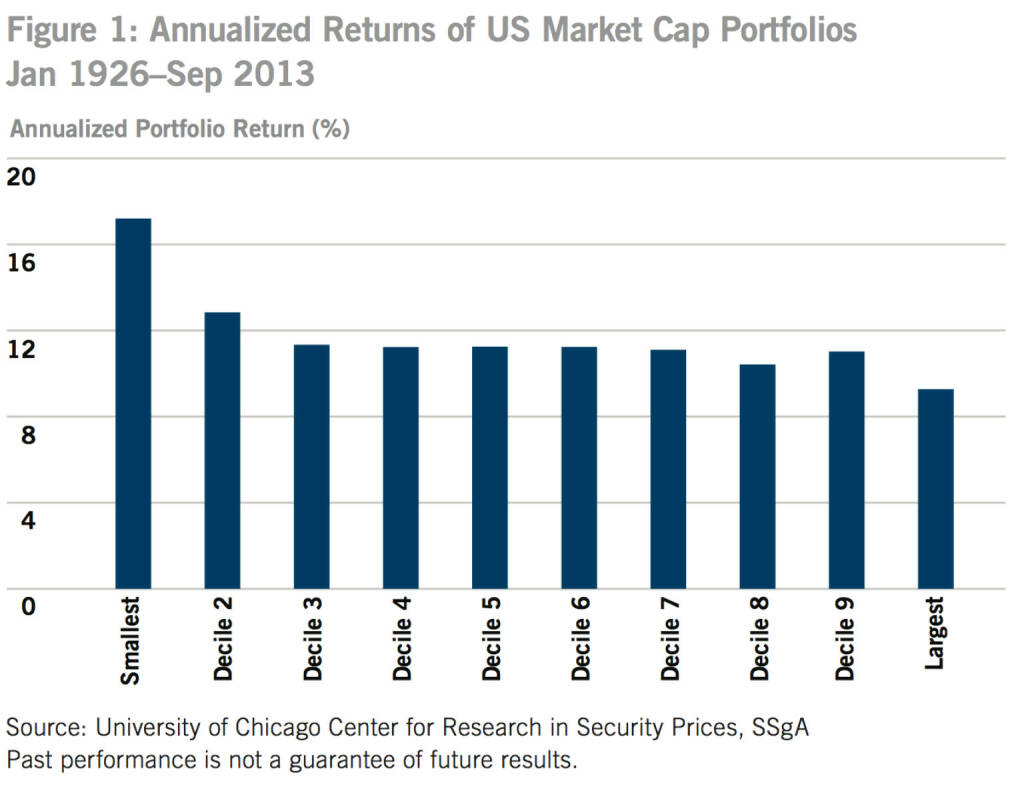
US-Figure 1: Annualized Returns of US Market Cap Portfolios Jan 1926–Sep 2013, © SSgA (05.01.2014)